Adding charts to a report |


|

|
|
|
Charts allow you to summarise data in a graphical format on the report. See below for details on how to add, edit and delete charts whilst in design mode in the report designer.
|
|
Adding a chart |
|
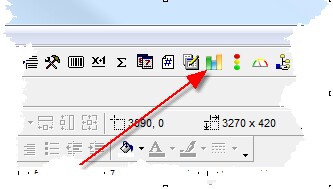
Select the charts button from the Tools Panel. |
|
|
|
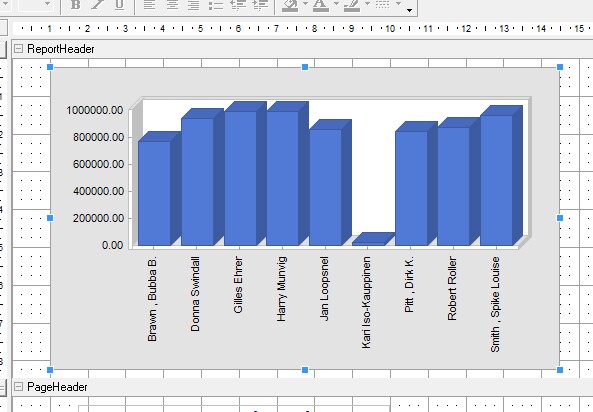
Resize the chart as required. |
|
Editing a chart |
|
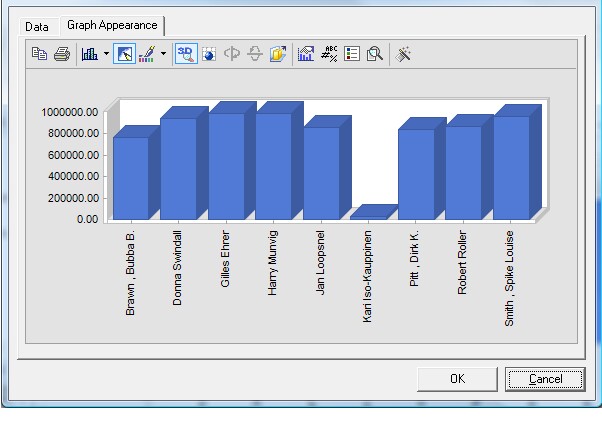
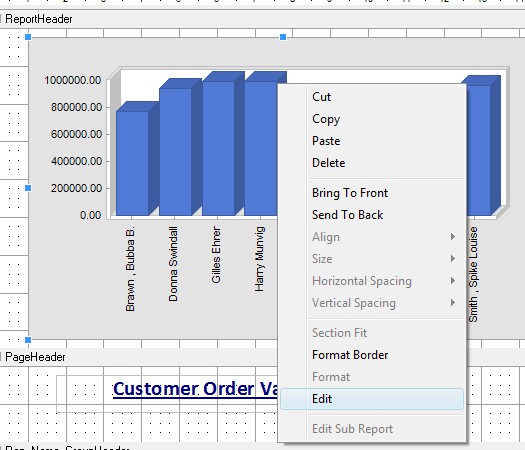
Select the chart in the sections panel, press the right mouse button and select Edit from the drop down menu. |
|
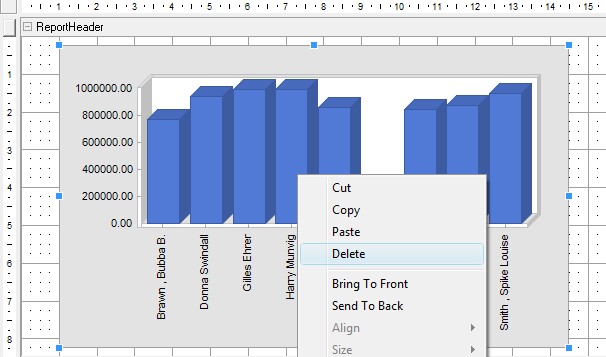
Deleting a chart |
|
Select the chart in the sections panel, then either press the delete key, or press the right mouse button and select delete from the drop down menu. |
|
| ||||