Adding traffic lights to a report |


|

|
|
|
Traffic lights allow you to simply represent numerical data as a KPI (key performance indicator) on the report. See below for details on how to add, edit and delete traffic lights whilst in design mode in the report designer.
|
|
Adding a Traffic Light |
|
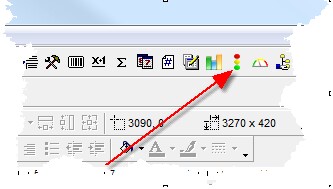
Select the traffic lights button from the Tools Panel. |
|
Select the data you want to represent with the traffic light. This can be either a database field, an expression or a fixed value. |
|
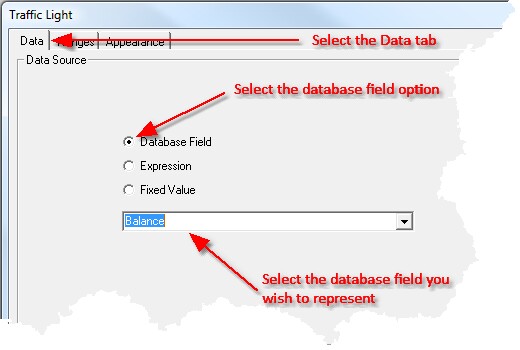
If you want your traffic light to represent the value of a database field returned by your query, select the Data tab in the traffic light dialog box, select the Database Field option, and select the field you wish to use. |
|
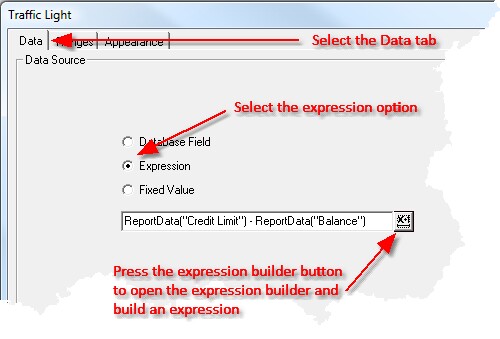
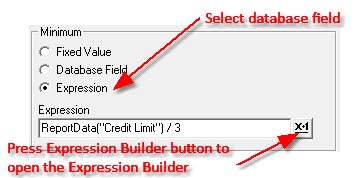
If you want your traffic light to represent the value of an expression, select the Data tab in the traffic light dialog box, select the Expression option, and press the expression builder button to open the expression builder and build your expression. |
|
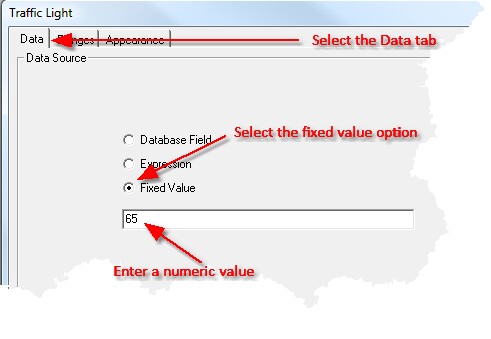
If you want your traffic light to represent a fixed value, select the Data tab in the traffic light dialog box, select the Fixed Value option, and enter a numeric value. |
|
Define the ranges you wish to use to represent your data. You can do this in two ways, either specify simply the minimum and maximum values for your traffic light, or specify the specific range for each colour used by the traffic light. For each minimum and maximum value, use the corresponding value panel to define either a fixed value, a database field value or an expression value. |
|
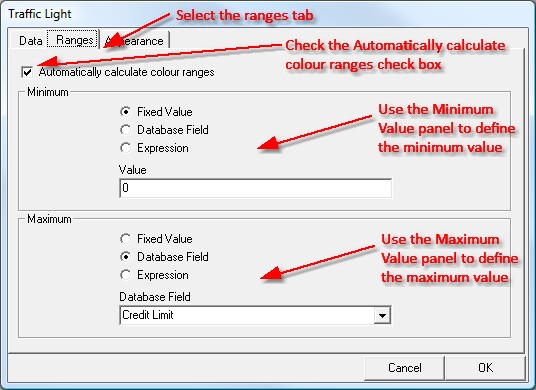
To specify simply the Minimum and Maximum values for your traffic light, select the Ranges tab in the Traffic Light dialog box, check the Automatically calculate colour ranges check box and define your minimum and maximum values using the corresponding value panel.
When the traffic light is rendered, DataPA will automatically calculate minimum and maximum values for each colour range based on your minimum and maximum values. |
|
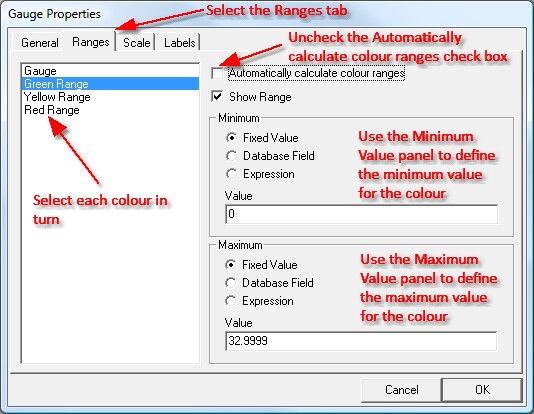
To specify specific Minimum and Maximum values for for each colour, select the Ranges tab in the Gauges dialog box, uncheck the Automatically calculate colour ranges check box, select each colour in turn and define your minimum and maximum values for that colour using the corresponding value panel. |
|
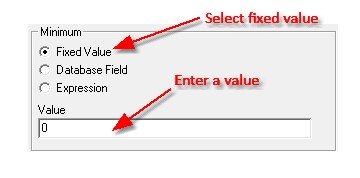
The Minimum and Maximum value panels allow you to define minimum and maximum values using either a database field, an expression or a fixedfixed value. |
|
To define a value using a fixed value, select the Fixed Value option and enter the value. |
|
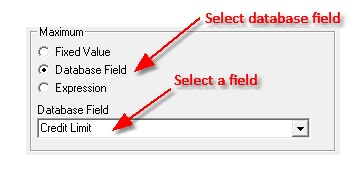
To define a value using a Database Field, select the Database Field option and select a field. |
|
To define a value using an expression, select the Expression option, then press the expression builder button to open the expression builder and build your expression. |
|
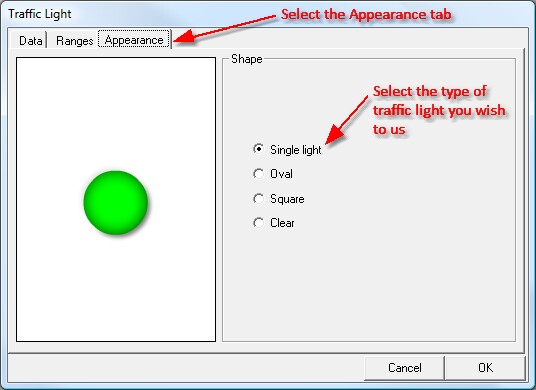
Finally, select the type of traffic light you wish to add to your report. You can choose between a single light, an oval traffic light, a square traffic light or a clear traffic light. |
|
To select the type of traffic light you would like to add to the report, select the Appearance tab, then select the type of traffic light you wish to use.
Finally, press OK to add your traffic light to your report and resize the traffic light as required. |
|
Editing a Traffic Light |
|
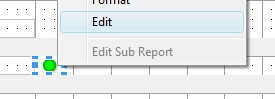
Select the traffic light in the sections panel, press the right mouse button and select Edit from the drop down menu. |
|
Deleting a Traffic Light |
|
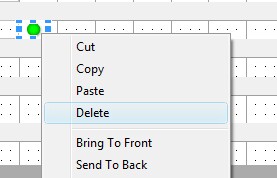
Select the traffic light in the sections panel, then either press the delete key, or press the right mouse button and select delete from the drop down menu. |
|
| ||||