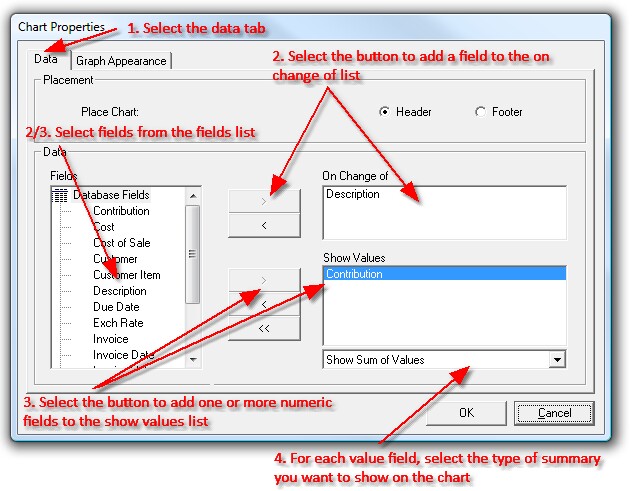
The Chart Properties dialog box allows you to add and modify charts on your report. See below for details on how to define data and position for your chart and how to define the appearance of your chart.
|
|||||||||||
|
|||||||||||
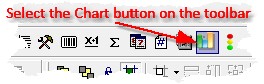
To open the Chart Dialog box, select the Chart Properties button from the Tools Panel. |
|
||||||||||
|
|||||||||||
To define the data your chart will show, follow these steps:
|
|
||||||||||
|
|||||||||||
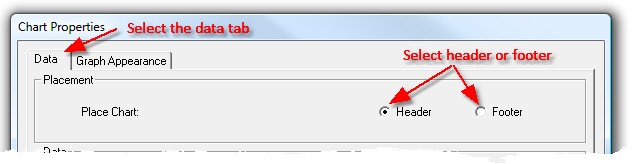
You can display a chart in the report header, or report footer of the report. To define the position of the chart, select the data tab in the Chart Properties dialog box, then select either the header or footer option. |
|
||||||||||
|
|||||||||||
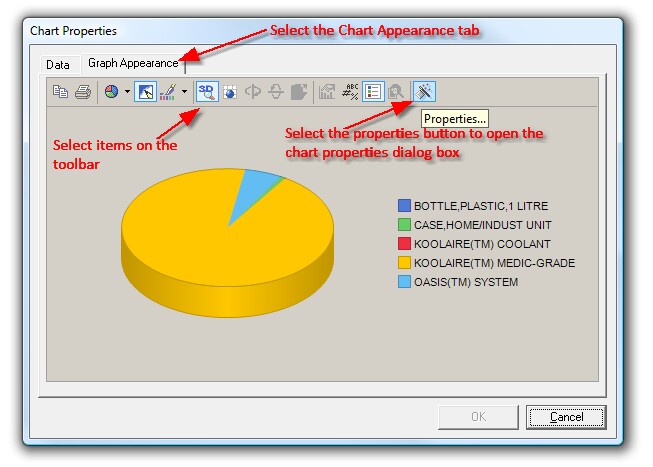
To define the appearance of the chart, select the Chart Appearance tab, then either select the items on the toolbar, or select the properties button to open the chart properties dialog box and change the properties of the chart.
All properties are updated in real time and reflected in the Chart Properties dialog box. |
|
||||||||||