Gauge Editor Data |


|

|
|
|
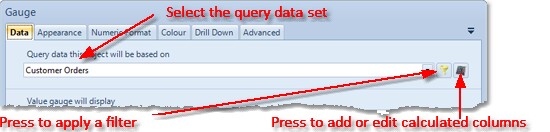
The Gauge Definition window Data tab allows you to specify the data that will be used to render your gauge.
Follow the steps below to specify the data; |
First select the Query data set that you wish to base your dashboard object;
If you wish to, press the filter button to apply a filter to your data set. If the values you require for your gauge are not directly available from the columns listed, press the Calculated Column button to open the Calculated Column Editor which allows you to add, modify or delete calculated columns. |
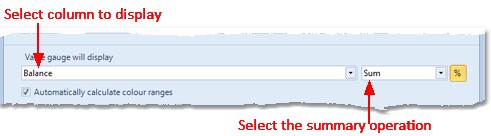
Next, you need to define the value that the gauge will display. First, select the column that represents the value that will be displayed. Next select the summary operation that will be used to calculate the value for the gauge. Finally, if you want the values on the gauge to be displayed as a percentage, select the percentage button. (
|
|
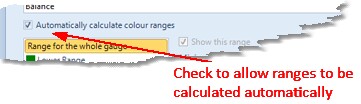
If the gauge object you are defining supports colour ranges, you can choose to allow the minimum and maximum values for each colour range to be calculated automatically, or set manually. If you opt to allow the colour ranges to be automatically calculated, each colour range will represent exactly a third of the range for the whole gauge. |
|
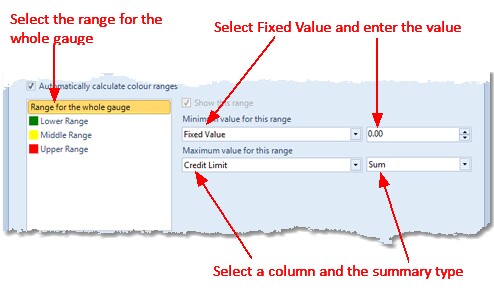
To define the range for the whole gauge (the minimum and maximum values that will be displayed on the range), first select the Range for the whole gauge option in the list of ranges.
Next we need to define a value for the minimum and maximum values. The value can be a fixed value, or a dynamic value derived from one of the columns in the data set.
To set a range value to a fixed value, select Fixed Value, then enter the value.
To set a range value to be dynamic, select the column, then the summary type that will be used to calculate the range value.
NB. If the value the gauge displays is smaller than the minimum value you have defined, or larger than the maximum value you have defined the range will be automatically extended to allow the value to be represented on the gauge. |
|
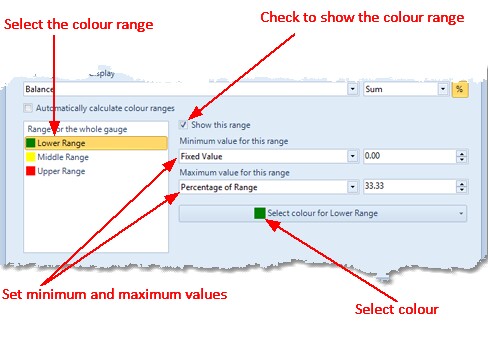
Next, if the gauge object we are defining supports colour ranges, we can choose whether to show each colour range and define how it will appear.
To show or hide a particular colour range, select the colour range in the list of ranges and check or uncheck the Show this range option.
The minimum and maximum values for a colour range can be a fixed value, or a dynamic value based on a percentage of the whole gauge range, or a summary calculation on a column in the data set.
To set a colour range value to a fixed value, select Fixed Value, then enter the value.
To set a range value to be dynamic based on a percentage of the whole gauge range, select Percentage of Range, then enter the percentage value.
To set a range value to be dynamic based on a column, select the column, then the summary type that will be used to calculate the range value.
Finally, select a colour for the colour range.
|
|
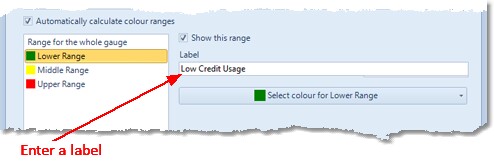
If you are defining a Traffic Light gauge object, you can enter a label for each of the colour ranges. You can choose the display these labels rather than the value on the gauge. |
|
| ||||