Dashboard Object Definitions - Totals |


|

|
|
|
The Dashboard Object Definitions editor window Totals tab allows you to specify if totals are included in a data grid, and how they are calculated.
Follow the steps below to define the totals for your data grid; |
||
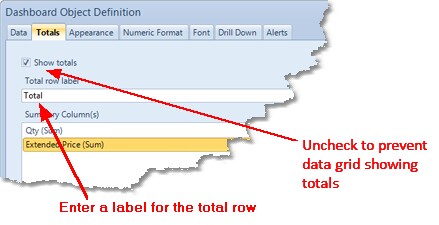
By default, a pivot table will include totals for each summary column you have selected. If you do not wish to include totals in your data grid, uncheck the Show Totals check box. You can also change the label used in the total row.
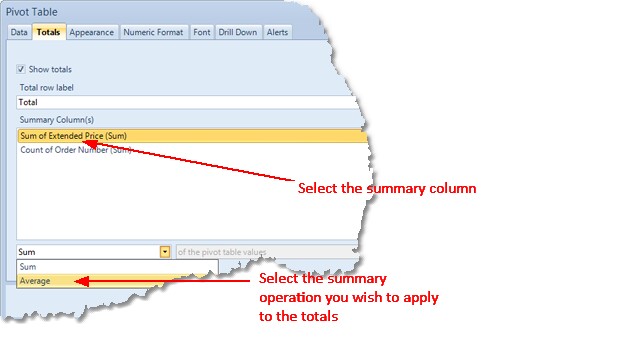
If you have opted to show totals, each total will by default use the same summary column as defined for the summary column itself. You may however wish to use an alternative summary operation for the totals. For instance, the summary column may be showing the sum of the quantity ordered, but you want the total to show the average quantity ordered. |
||
|
To change the summary operation used by the totals, select the summary column the total is based on, then select the summary operation you wish to apply to the totals. |
|
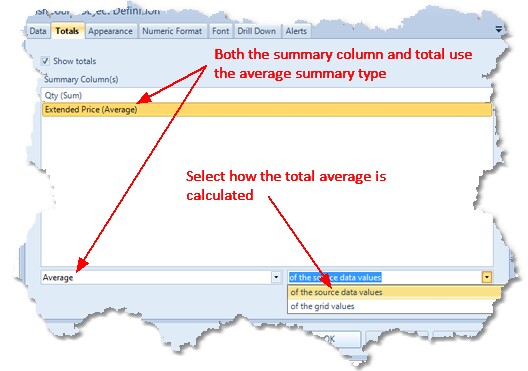
If the summary column and total both use the Average summary type, you have a choice of how the average total is calculated. The two options are described below;
Average of the source data values
Average of the pivot table values This option calculates the average by totalling the average values displayed in the grid for the specific grouping, and dividing the total by the number of average values displayed in the grid for the specific grouping. |
|
|
| ||||