Dashboard Object Definitions - Appearance |


|
|
|
|
The Dashboard Object Definition window Appearance tab allows you to specify settings that will govern the appearance of the dashboard object.
Follow the steps below to specify the appearance of your dashboard object; |
||||||||
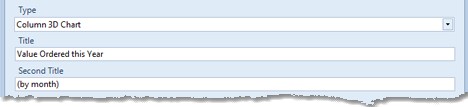
First if you want to change the type of object, select the new object type. Then enter a title, and, if you wish, second title (that will appear on a second line) for your Dashboard Object.
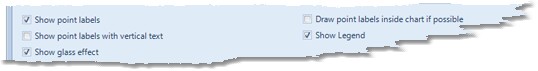
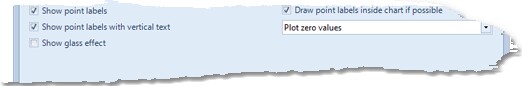
Select whether you want to view point labels on your chart, whether those labels should (if possible) be drawn inside the chart, whether they should be shown with vertical text, whether to show a legend on the chart and whether to use the glass effect when rendering the chart.
For certain types of chart, you will be given the option to specify that zero values are not plotted. You can select one of three possible values in the drop down list, each described in the table below;
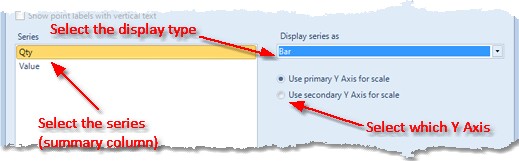
For certain chart types, you can also select whether to display a series as a line, bar or area, and if the object type has a dual Y axis, which Y axis to display the series on.
|
| ||||