Dashboard Object Definitions - Data |


|

|
|
|
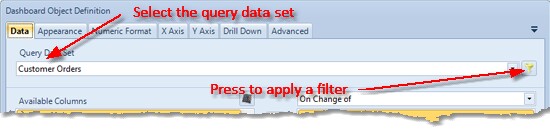
The Dashboard Object Definition window Data tab allows you to specify the data that will be used to render your dashboard object.
Follow the steps below to specify the data; |
First select the Query data set that you wish to base your dashboard object;
If you wish to, press the filter button to apply a filter to your data set. Next, decide how you want to group your data, and select the appropriate option;
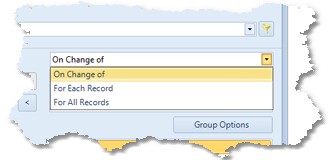
The options are described below; |
On Change of |
Creates a record for each distinct combination of the group values selected. |
For Each Record |
Creates a record for each record in the source data set, regardless of the group values selected. The For Each Record option will only be offered if you are defining data for a data grid. If you select this option, you will not be able to specify any summary columns as the records are not summarised. |
For All records |
Creates a single record regardless of the group values selected. |
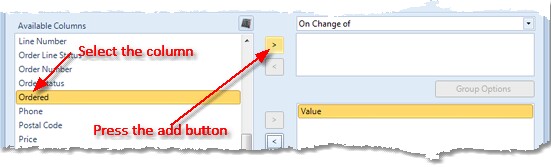
Next, add the group columns you require (some object types will only allow a single group column).
|
|
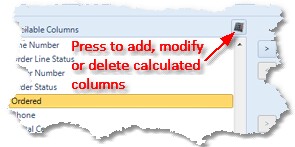
If the value you require is not directly available from the columns listed, press the Calculated Column button to open the Calculated Column Editor which allows you to add, modify or delete calculated columns. |
|
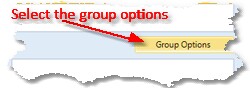
If you wish to, you can change the way group values are grouped, sorted and displayed by selecting the group options button to open the group options window. |
|
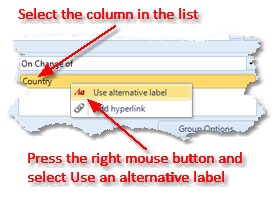
If you are defining data for a data grid or multi series chart, you can specify an alternative column label for the group column if required. To specify an alternative label, select the group column in the list, press the right mouse button and select Use alternative label from the drop down menu. This will open the edit label dialog box to allow you to edit the label. |
|
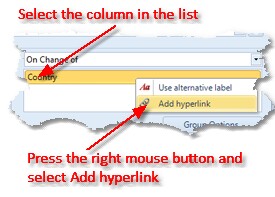
If you are defining data for a data grid, you can specify a hyperlink for the group column if required. To specify an hyperlink, select the group column in the list, press the right mouse button and select Add hyperlink from the drop down menu. This will open the define hyperlink dialog box to allow you to edit the label. |
|
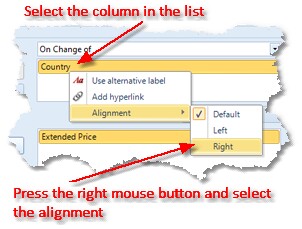
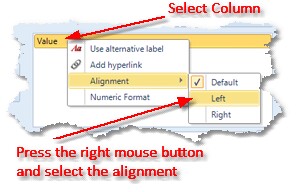
If you are defining data for a data grid, the grid will automatically align numeric columns to the right, and non-numeric columns to the left. You can override this behaviour by selecting the column in the list, pressing the right mouse button then selecting either left or right in the Alignment sub menu. |
|
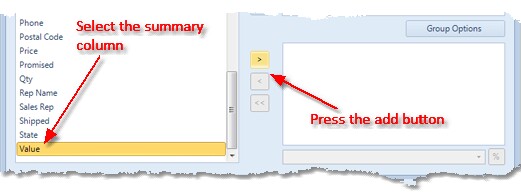
Next, select which summary columns you require (some object types will only allow a single summary column).
|
|
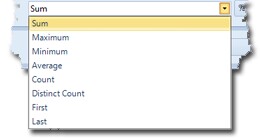
For each summary column, select the summary operation you wish to be applied. Distinct count is the number of distinct values in the column for the group selected. |
|
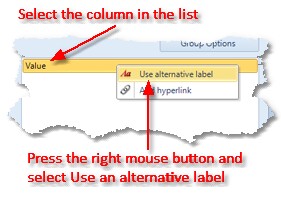
If you are defining data for a data grid, you can specify an alternative column label for the summary column if required. To specify an alternative label, select the summary column in the list, press the right mouse button and select Use alternative label from the drop down menu. This will open the edit label dialog box to allow you to edit the label. |
|
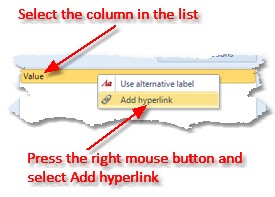
If you are defining data for a data grid, you can specify a hyperlink for the summary column if required. To specify an hyperlink, select the group column in the list, press the right mouse button and select Add hyperlink from the drop down menu. This will open the define hyperlink dialog box to allow you to edit the label.
|
|
If you are defining data for a data grid, the grid will automatically align numeric columns to the right, and non-numeric columns to the left. You can override this behaviour by selecting the column in the list, pressing the right mouse button then selecting either left or right in the Alignment sub menu.
|
|
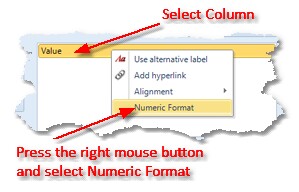
If you are defining a data grid, you can specify specific numeric formatting for each of the summary and group data columns. To override the default numeric format for a specific column, select the column, then press the right mouse button and select the Numeric Format option. This will open the Numeric Format tab of the Data Grid Format dialog to allow you to specify the format. |
|
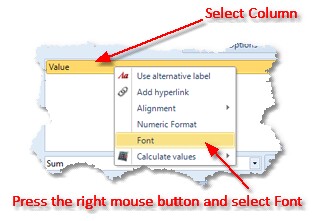
If you are defining a data grid, you can specify specific text appearance for each of the summary and group data columns. To override the default text appearance for a specific column, select the column, then press the right mouse button and select the Font option. This will open the Font tab of the Data Grid Format dialog to allow you to specify the format. |
|
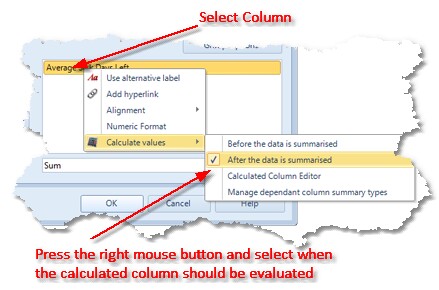
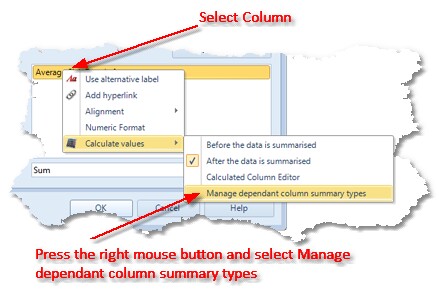
If you have added calculated columns as summary values, you can modify when the calculation is executed. For instance, consider a calculated value that evaluates an average. By default, the average will be calculated on each row returned by the query before the summary data is created, and the value in the summary data will be the sum of those values. However, you may want the individual values added together for a specific grouping, then the average calculated on the summary data values.
To change when a calculated column is calculated for a specific summary column, select the column, then press the right mouse button and select Before the data is summarised or After the data is summarised in the Calculated values menu option.
You can also open the Calculated Column Editor to edit the calculated column by selecting the Calculated Column Editor option in the menu. |
|
If you specify that a calculated column is evaluated after the data is summarised, each of the dependant columns are summarised for the group, and then the calculation is evaluated on the summary values. By default, the dependant columns will be summarised using the summary function specified for the calculated column.
However, you may wish to specify a specific summary function for one or all of the dependant columns. To do this select the column, then press the right mouse button and select the Manage dependant column summary types which opens the Dependant Column Summary Definition window to allow you to specify the summary type for each dependant column. |
|
Finally, if you want your summary column to be displayed as a percentage, select the percentage button. ( |
| ||||