Gauge Editor DrillDown |


|

|
|
|
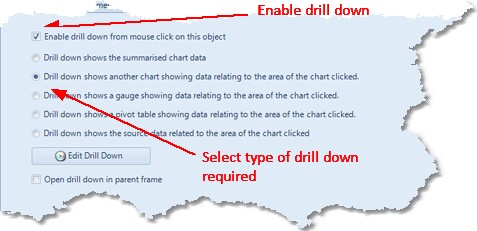
The Gauge Editor window Drill Down tab allows you to specify if your dashboard object will have a drill down, and if so, what the drill down will display.
Follow the steps below to specify the drill down;
First, if you want the gauge to have a drill down, select the enable drill down checkbox.
Next, select which type of drill down you want. The three options are described in detail below; |
Drill down shows the summarised chart data |
The drill down will show a data grid containing the summarised gauge data as defined in the Data Tab and as used to render the gauge. |
Drill down shows another chart showing data relating to the area of the chart clicked |
The drill down will show a chart that summarises gauge data |
Drill down shows a gauge showing data relating to the area of the chart clicked |
The drill down will show a gauge that summarises gauge data |
Drill down shows a pivot table showing data relating to the area of the chart clicked |
The drill down will show a pivot table that summarises gauge data |
Source data related to the area of the chart clicked |
The drill down will show a data grid with the query data selected in the data tab, filtered to show only the data relating to the gauge. |
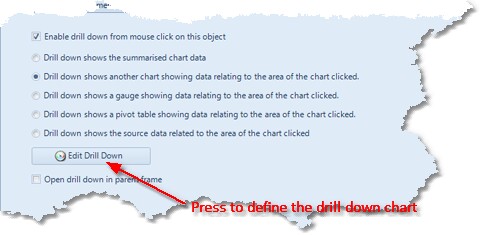
If you select to drill down into another chart, pivot table or gauge, press the Edit Drill Down button, to open the Dashboard Object Definition, Gauge Editor or Pivot Table Editor window to define the drill down that will be displayed.
|
|
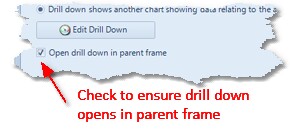
If you select the Open drill down in parent frame, the drill down will be opened in the same panel as the parent object. If this option is not checked, the drill down will be opened in a popup window.
|
|
| ||||