Pivot Table Editor |


|

|
|
|
The Pivot Table editor window allows you to specify the appearance and behaviour of pivot tables that have been added to your dashboard tabs.
A pivot table is a tabular representation of data that can automatically sort, count, total or give the average of data quickly creating unweighted cross tabulations. |
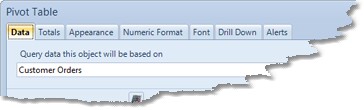
The Pivot Table editor window consists of the following tabs; |
Allows you to define the data that will populate the pivot table. |
|
Allows you to specify if totals are included in the pivot table, and how they are calculated. |
|
Allows you to specify settings that will govern the appearance of the pivot table. |
|
Allows you to specify the numeric format used to display numbers in the dashboard object. |
|
Allows you to specify the font used to display data in the pivot table |
|
Allows you to add and define a drill down for the pivot table |
|
Allows you to define alerts for your pivot table |
| ||||