Dashboard Properties Tuning Tab |


|

|
|
|
The Dashboard Properties tuning tab allows you to analyse and tune the performance of your dashboard.
|
||||||||||||||||||
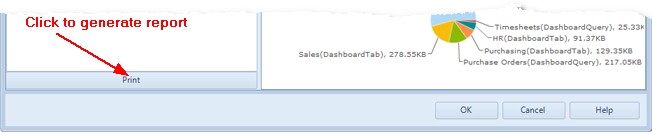
The tuning tab gives a lot of information about the dashboard that is open in the client application. This information can be very useful in identifying and resolving performance issues for the dashboard. If you want to share the information contained in the tab, click on the print button at the bottom of the screen to generate a pdf or rtf report that contains all of the information from this screen.
The time a dashboard takes to load in the web, or mobile apps is affected by the amount of data the server must load to render that dashboard. Obviously reducing the number of objects on a dashboard, or reducing the amount of data the query returns will help, but often this is not ideal as it forces us to compromise the dashboard itself.
So, there are a number of strategies that can be employed to reduce the amount of data the server has to load to render your dashboard. Each of these is outlined below;
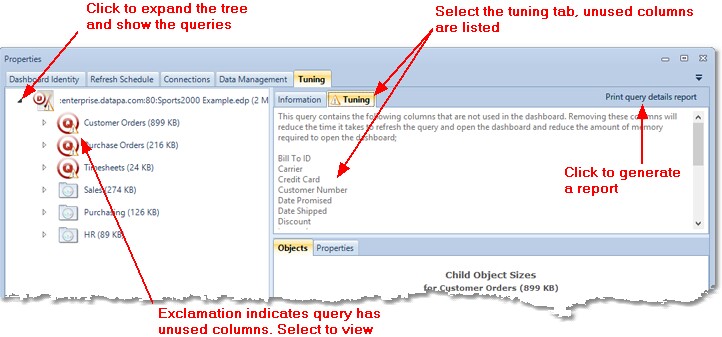
Remove any unused columns from the query Often, when we define a query for a dashboard, we do not know at the outset which columns are required so we select them all. This means it is likely that there are a number of columns returned by the query that are not required to render the dashboard. If these columns are not removed, they will unnecessarily increase the size of the dashboard on disk and the time and memory required for the client application, DataPA Enterprise Service and web application to manage this dashboard. By simply removing these unused columns, you can often realise a significant improvement in performance.
To quickly find any unused columns in a dashboard, follow these steps;
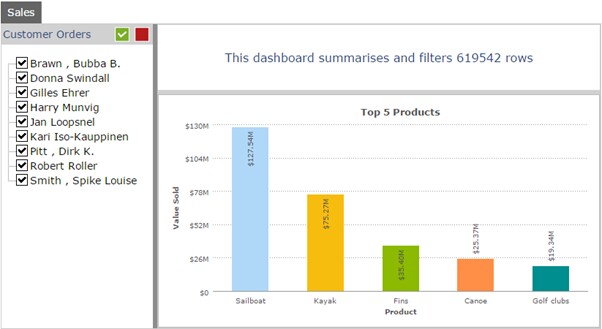
Preventing the dashboard loading source data DataPA OpenAnalytics employs a strategy of building partial summaries to improve performance. Let’s take the example of the dashboard shown below;
The source data contains over 600 thousand rows of data. However, to display every possible combination of filters on the dashboard, we only require the figures broken down by the 9 sales reps and 1015 customers. So the dashboard builds a partial summary by summarising the value sold by sales reps and customers. When rendering the dashboard in the web, the server only needs to load this partial summary table, which contains approximately 9 thousand rows, rather than the full dataset with over 600 thousand rows (and many more columns).
However, there are a number of scenarios where the dashboard will not create a partial summary for a particular object on the dashboard. If this is the case, when the dashboard is viewed in the web of mobile device, the server must load the source data for this dashboard. For large dashboards this can be a significant overhead.
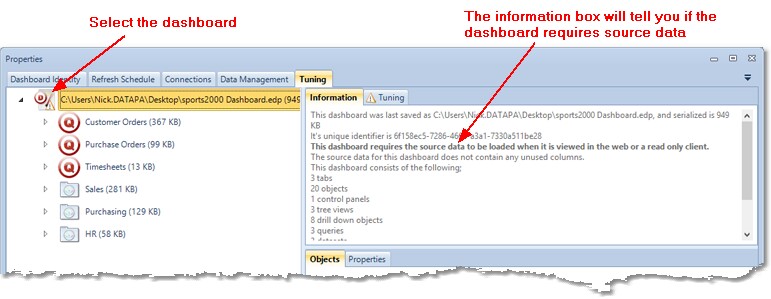
To find out whether your dashboard will needs to load source data, follow these steps;
You can determine which objects are responsible for the dashboard requiring source data by clicking on the tuning tab. The objects will be listed as hyperlinks. Click on each object will take you to the tuning tab for that particular object, and explain why the object requires source data.
There are four possible reasons an object will not create a partial summary. Each is described below, along with possible remedies;
Iteration type If the iteration type for an object is set to “For Each”, every row of the source data is required to generate this object. As such, the object requires source data. This cannot be remedied without changing the iteration type.
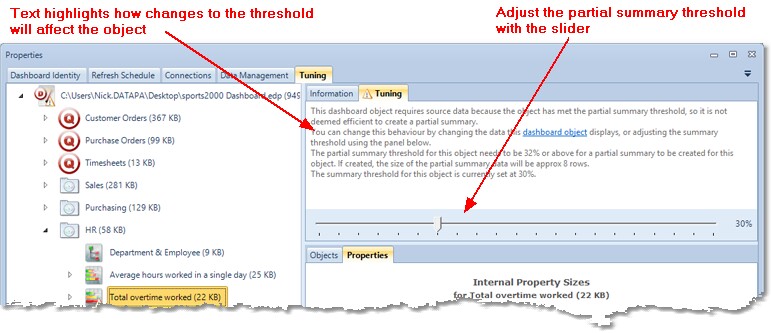
Partial summary threshold Sometimes the data shown in an object on a dashboard is such a low level, the partial summary generated would be large enough to offer little benefit, and in some cases cause a significant drop in performance.
As such, the dashboard applies a partial summary threshold. By default, if the size of a partial summary would be 30% or greater of the source data, the partial summary is not created. In this circumstance the source data will be loaded.
You can change this behaviour by editing the object to change the way the data is summarised, or adjusting the partial summary threshold. The tuning panel for the object will indicate how changes to the partial summary threshold will affect the object. Take the example below;
For this particular object, a small increase in the threshold to say 35% would mean the partial summary is created. More importantly, the partial summary will only be 8 rows of data, so creating it will have a negligible impact. In this scenario, increasing the partial summary threshold would be beneficial.
A calculated column dependent on a filter parameter It is possible to create a calculated column that is dependent of a filter parameter. As such, if the user changes the value of the filter parameter, the calculated column value for the entire source data must be recalculated to rebuild the object. This cannot be remedied without removing this dependency.
Drill down to source data If you choose to define a drill down on an object to drill into the source data, the object will require the server to load source data to render the dashboard. This cannot be remedied without changing the type of drill down defined for the object. |
| ||||