Group Options - Group Selection

Top  Previous  Next  

The Group Options window Group Selection tab allows you control how group values are selected to be displayed in your dashboard object or drill down.


Follow the steps below to specify how group values are selected;


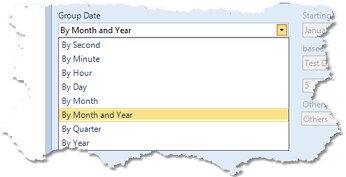
If the group is a date, or date-time value, select which time interval you want to be used to group the data;


clip499

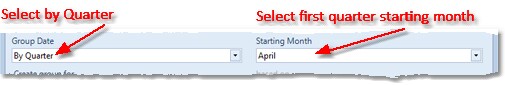
If you elect to calculate your groups using quarter, select which month your first quarter starts in;

clip500


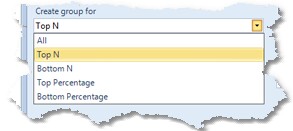
Next, if there are too many group values to display on a single chart you can limit the number of groups shown by selecting one of the group limiting options, described below.

clip502

All

Shows all groups

Top N

Shows a specified number of groups with the highest summary value.

Bottom N

Shows a specified number of groups with the lowest summary value.

Top Percentage

Shows groups where a specified summary value is in the top percentage specified.

Bottom Percentage

Shows groups where a specified summary value is in the bottom percentage specified.

clip501

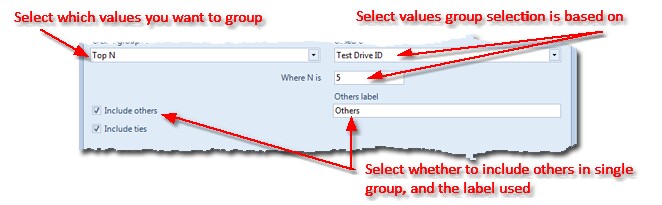
To limit the number of groups show, do the following;


1.Select one of the group limiting option (top n, bottom n, top percentage, bottom percentage)
2.Select the summary column the order or the groups are based on.
3.Enter a value for the number of groups (N) or percentage.
4.If you want to include all other groups in a single group on the chart, select Include Others and enter a label for the extra group.
5.If you want to include ties, select the include ties option. If you opt to include ties, and multiple groups have exactly the same summary value, all the equal groups will be included in the chart.


Copyright © 2003-2017 DataPA Limited, all rights reserved. DataPA OpenAnalytics 6.0