Dashboard Object Definitions - Y Axis |


|

|
|
|
The Dashboard Object Definition window Y Axis tab allows you to specify settings that govern the appearance of the Y axis on the dashboard object.
Follow the steps below to specify the Y Axis details on your dashboard object; |
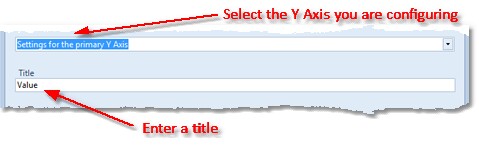
First, if you are configuring a dashboard object with a dual Y axis, you can specify a configuration for each Y axis. As such, you need to select which Y axis you are specifying the details for.
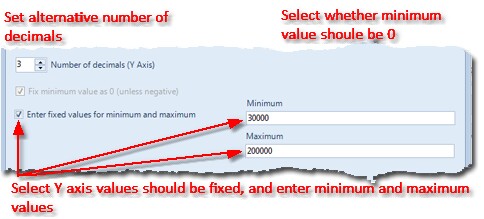
Next enter a title for your y axis. If you want, you can specify an alternative number of decimal places for this Y axis, that will override the value specified in the numeric format.
If all the values to be plotted on a Y Axis are either positive, or all negative, by default the Y Axis will always have a minimum value (or maximum if all your values are negative) of zero. If all your values are well above (or well below) zero if might be sensible to uncheck the fix minimum value as zero option so it is easier to differentiate values plotted against your Y Axis.
Alternatively, you can override that automatic calculation of the Y Axis range, by selecting that Y Axis values should be fixed, and specifying the minimum and maximum values. (NB. If the values in your chart cannot be plotted on the range you have given, the range will be extended to compensate). |
| ||||