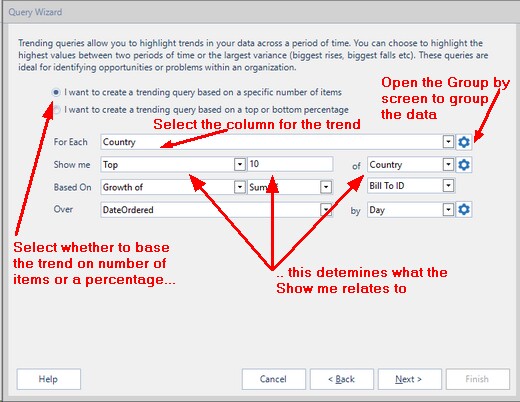
You have already selected the Subject that you wish to base your Query on and that you wish the Query to be a Trending one, the Subject may contain data Columns that you do not wish to be included in your Query. The Query Wizard - Select Columns form lets you choose which Columns will be included in your Query, and which which of those columns should be used for grouping the data and which of those fields should be used to calculate the trending.
The options available for creating a trend on are detailed in table below:
Option
|
Description
|
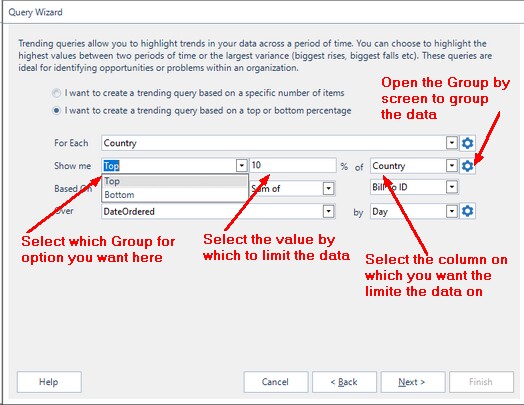
Top N of
|
Setting this option limits the data to just the Top N records for this trend based on the type of trend selected, the Summary Field value selected in the Trend Based On drop down list and the value entered in the Where N is box.
So, for example, if you enter 5 for the value in the Where N is box, the group field is Country and the date field is Year of Date Ordered, the type of trend selected is based on Growth of and the Trend Based On field selected is Sum of Extended Price then you will get results from your query, for that group, of the top 5 counties whose Sum of the Extended Price has grown most from the first year to the last year over the period of order data being queried.
|
Bottom N of
|
Setting this option limits the data to just the Bottom N records for this trend based on the type of trend selected, the Summary Field value selected in the Trend Based On drop down list and the value entered in the Where N is box.
So, for example, if you enter 5 for the value in the Where N is box, the group field is Country and the date field is Year of Date Ordered, the type of trend selected is based on Growth of and the Trend Based On field selected is Sum of Extended Price then you will get results from your query, for that group, of the bottom 5 counties whose Sum of the Extended Price has grown the least from the first year to the last year over the period of order data being queried.
|
Top Percentage of
|
Setting this option limits the data to just the Top N % of records for this trend based on the type of trend selected, the Summary Field value selected in the Trend Based On drop down list and the value entered in the Where N is box.
So, for example, if you enter 10 for the value in the Where N is box, the group field is Country and the date field is Year of Date Ordered, the type of trend selected is based on Growth of and the Trend Based On field selected is Sum of Extended Price then you will get results from your query, for that group, of the top 10% of counties whose Sum of the Extended Price has grown most from the first year to the last year over the period of order data being queried.
|
Bottom Percentage of
|
Setting this option limits the data to just the Bottom N % of records for this trend based on the type of trend selected, the Summary Field value selected in the Trend Based On drop down list and the value entered in the Where N is box.
So, for example, if you enter 10 for the value in the Where N is box, the group field is Country and the date field is Year of Date Ordered, the type of trend selected is based on Growth of and the Trend Based On field selected is Sum of Extended Price then you will get results from your query, for that group, of the bottom 10% of counties whose Sum of the Extended Price has grown the least from the first year to the last year over the period of order data being queried.
|
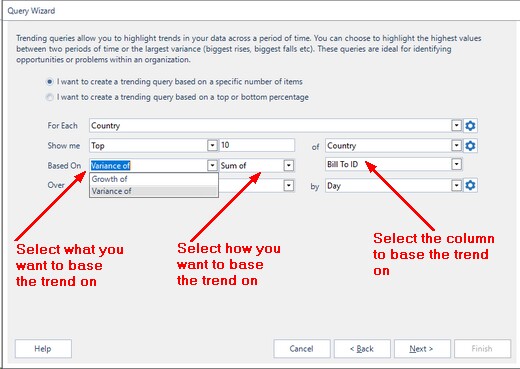
Next you need to select what type of trend you want to look for.
The two options for trend based on are detailed in the table below:
Option
|
Description
|
growth of
|
This option allows you to search for the trend of growth in the data and it can be used for both positive growth (Top N and Top Percentage) and negative growth (Bottom N and Bottom Percentage). To come to a growth figure for each group it calculates the first and last values based on the time series provided by the date field used and considers the difference between these.
|
variability of
|
This option allows you to search for variability in the data. To come to a variability figure for each group it calculates the difference between each value in the time series provided by the date field used and sums these differences to provide a variability index. This value is not returned in the data, it is just used to identify the most or least variable groups.
|
The trend based on can be based on the following options, these options will vary dependent on the column's data types,
Option
|
Option
|
Option
|
Sum of
|
Average of
|
Maximum of
|
Minimum of
|
Count of
|
Distinct Count of
|
First of
|
Last of
|
|
which can be from any of the available listed columns.
You can now set the period of time query is to be over
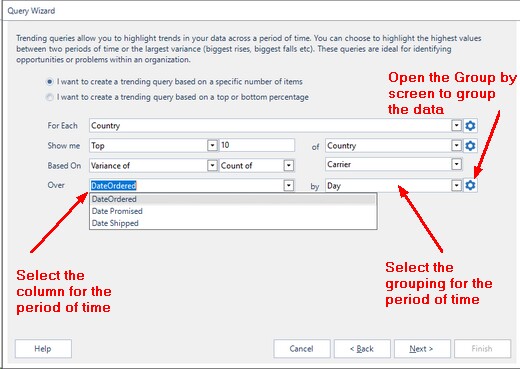
Firstly select one of the available date/datetime columns, select select the grouping for the period of time
Option
|
Option
|
Option
|
Second
|
Minute
|
Hour
|
Day
|
Week
|
Month
|
Year/Month
|
Quarter
|
Year
|
Further Grouping options can be set using the Group By Screen
The other options are detailed in the table below.
Option
|
Description
|
Trend Based on
|
This option can be set by selecting a field from the top right drop down list. In this list will be each field that has been added as a Summary Field back in the Query Wizard. The Field selected here will be the one used in calculations when identifying the trend required for this group.
|
Where N is
|
This box is where you enter the values that are used with the Top N, Bottom N, Top Percentage, or Bottom Percentage to identify the number of records you are interested in for this group.
|
Include Ties
|
The Include Ties option allows you to decide if you want to include records whose values are the same in your results. So for example if you set a Top N to give you just the Top 5 Countries whose order revenue has grown over the last 5 years and the Country in position 5 and the Country in position 6 have the same growth value then setting the Include Ties will mean you see both the Country in position 5 and the country in position 6 in your results. If you set Include Ties to be off then you would only see the Country in position 5 in your results.
|
Once you have set your Trend, click on the 'Next >' button to go to the Sort Options Screen .
|